
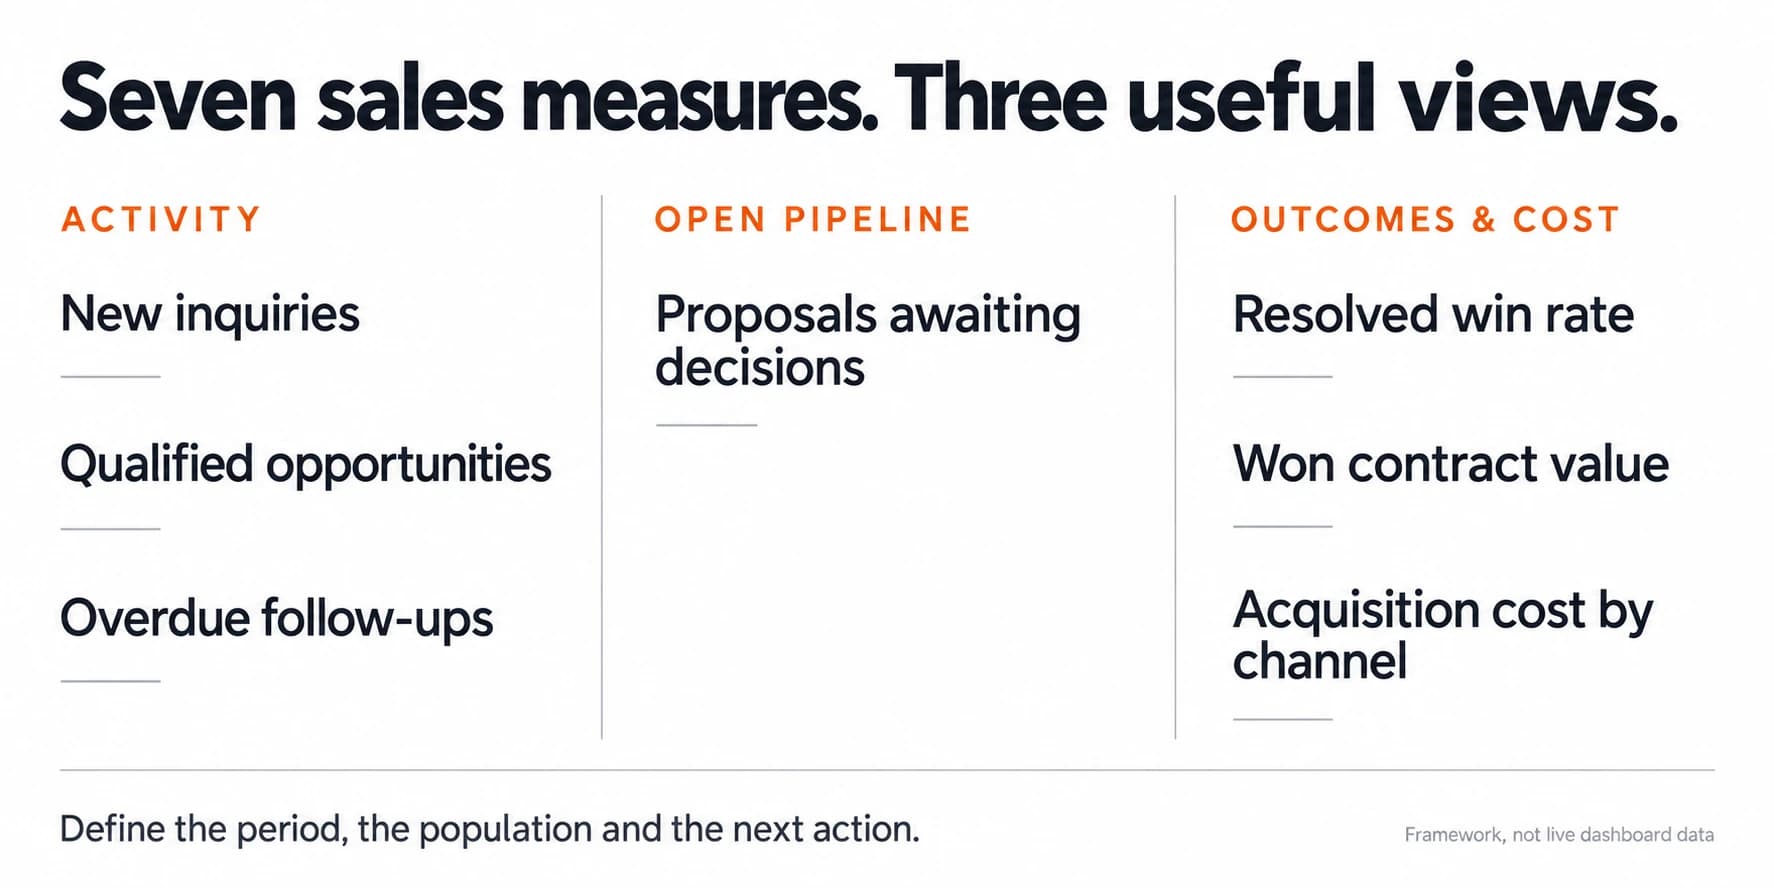
For a small contractor, start with seven measures: new inquiries, qualified opportunities, overdue follow-ups, proposals awaiting decisions, resolved win rate, won contract value and channel acquisition cost.
The important part is not the chart type. It is the definition behind each number and the action it leads to.
Keep sales reporting separate from delivery reporting
Sales reporting covers the journey from inquiry to commercial award. Delivery reporting covers the work you have already committed to perform.
They should connect, but they answer different questions. Crew availability and site blockers belong in your construction operations dashboard. The sales dashboard shows what may enter that workload, when a decision is expected and what the team must do next.
A large pipeline is not automatically good news. If it is full of poor-fit projects, stale quotes or work you cannot staff, it is a demanding collection of possibilities.
The seven measures worth starting with
1. New project inquiries by source
Count distinct project inquiries received during the reporting period. Show the source and separate repeat-customer projects from new-customer inquiries.
Do not count three messages about one bathroom renovation as three leads. Keep spam, test submissions and noncommercial contacts out of acquisition totals, while preserving the original records where needed.
This measure tells you what entered the process. It does not establish quality or revenue.
2. Qualified opportunities
Count opportunities that meet your documented fit criteria: service type, geography, practical timing and any commercial conditions your team uses.
Show newly qualified opportunities for the period separately from the total open qualified pipeline. One is recent activity; the other is a current balance.
If half the team qualifies based on project size and the other half qualifies anyone who answers the phone, the number cannot support a decision. Agree the definition first.
3. Overdue next actions and response coverage
Show open opportunities whose next action is overdue, including owner, due date and required action. Add inquiries without an assigned owner or first response when that information is reliably recorded.
You can track first-response time, but distinguish elapsed time from working-hours time. State which you use and keep the convention consistent. Set targets according to your coverage, not an unexplained industry benchmark.
This is the most useful daily view because it turns the dashboard into an action queue.
4. Proposals awaiting a decision
Show the number and value of outstanding proposals, days since issue, expected decision date and next agreed follow-up. Make the value basis clear, particularly if a proposal has optional items.
Replace an old revision when a new one supersedes it. Do not add both versions to pipeline value.
Age alone does not mean a proposal is dead. A customer may be waiting on financing or design information. Record the reason and a realistic next review date instead of guessing.
5. Resolved opportunity win rate
For a stated population, divide won opportunities by won plus lost opportunities. Show open and not-proceeding records separately, with a clear rule for how not-proceeding cases are treated.
For a lead-source comparison, use an inquiry cohort and allow time for the normal sales cycle. Otherwise, a source with slow-moving projects can look worse simply because its opportunities are still open.
In a fictional cohort with four wins, six losses and five open opportunities, resolved win rate is 40%. It does not mean 40% of all inquiries will ultimately win. Five outcomes remain unknown.
Avoid tiny-sample certainty. One win out of two decisions is not a dependable forecast.
6. Won contract value and expected delivery timing
Show the agreed value of jobs won during the period and the expected delivery window. Use your approved definition of award and state how taxes, allowances or optional scope are handled.
Keep this separate from open pipeline value, invoices and cash collected. A signed project worth $40,000 is not $40,000 available in the bank.
Add estimated contribution only if your costing data supports it. Label it as an estimate and identify the cost basis. Do not turn incomplete estimates into a margin promise.
7. Acquisition cost by channel
For a consistent cohort, divide attributable acquisition spend by the number of new customers won from it. If you calculate cost per won project instead, label that different denominator explicitly.
Keep direct lead charges, advertising, other paid marketing and any included sales labor clearly defined. Do not compare one channel including staff time with another excluding it.
Thumbtack, for example, describes budget and lead-pricing controls rather than a universal cost for every contractor. Use your actual charges, not someone else's estimated rate. Thumbtack for pros. Track Thumbtack lead outcomes and Yelp follow-up against their own source evidence rather than grouping every online inquiry together.
When no customers have been won, show the cost metric as unavailable. Preserve the spend and unresolved opportunities so the business can see why.
Use three views, not one overloaded screen
A small dashboard can have an activity view for the last week, an open-pipeline view as of today and an outcomes view for sufficiently mature inquiry cohorts.
Put the reporting date and refresh time beside the figures. Let the team filter by owner, project type and source without changing the underlying definitions.
Every headline number should lead to its records. If the dashboard says eight follow-ups are overdue, you should be able to identify all eight. If that requires somebody to recreate the list manually, the reporting setup is incomplete.
Keep contact and opportunity records linked in the CRM. CRM association models support those relationships, but the way you define projects, sources and stages remains your responsibility. HubSpot's record-association documentation.
Run a short weekly decision review
Start with overdue actions and important opportunities without a clear next step. Then review proposal decisions, source quality and the delivery capacity required by likely awards.
For each issue, assign one action and owner. Examples include confirming a customer's decision timing, collecting missing scope information or revisiting a lead source that repeatedly produces unsuitable work.
Do not spend the meeting celebrating total pipeline value while ignoring records that have not changed in months. Remove false certainty, not inconvenient records.
The dashboard should support a consistent construction sales process. Blackwing can help define that process, structure the CRM and build reporting that points to useful decisions. Book an operations review if your sales reports look complete but the next actions are still unclear.
FAQ
What should a small contractor's sales dashboard include?
Start with new inquiries, qualified opportunities, overdue actions, outstanding proposals, resolved win rate, won contract value and channel acquisition cost. Define the population and period for each measure and link every figure to its underlying records.
How do you calculate a construction sales win rate?
Divide won opportunities by won plus lost opportunities for a defined population. Report open cases separately and state how not-proceeding cases are treated. Use comparable inquiry cohorts when evaluating lead sources with different sales-cycle lengths.
Is pipeline value the same as booked revenue?
No. Open pipeline value represents potential work. Won contract value represents awarded work under your definition of award. Recognized revenue, invoicing and cash collection are separate accounting and cash-flow measures.
How often should a contractor review the dashboard?
Review new inquiries and due actions each working day, with a short weekly review of pipeline health and outcomes. Evaluate acquisition economics after enough time has passed for the relevant inquiry cohort to resolve.